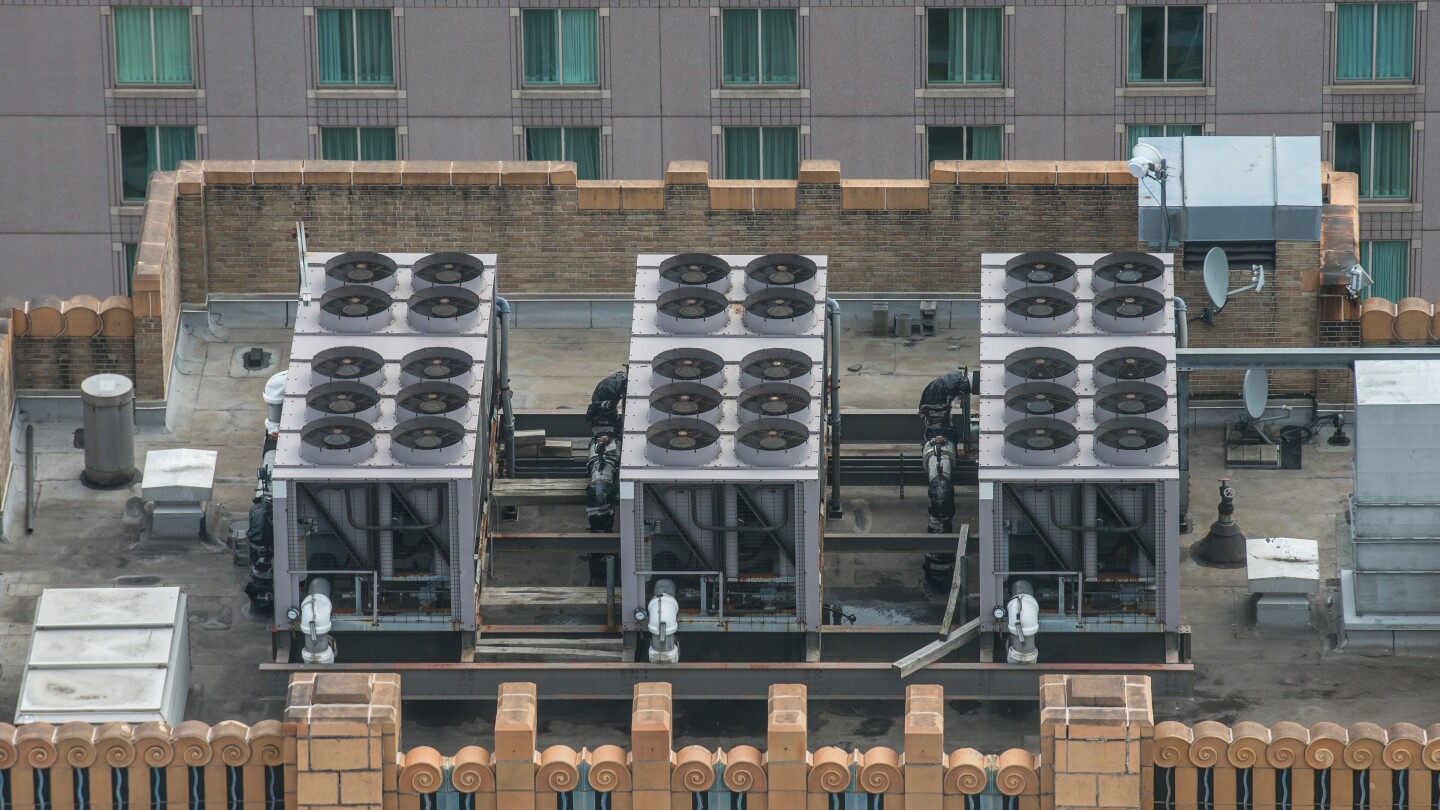
This picture shows the HVAC system on the rooftop of a skyscraper
Facility energy optimization provides an organization’s facilities team low-hanging-fruit opportunities for reducing costs and carbon. Data-driven analysis can help to identify fault detection and drive energy efficiencies for facilities management.

Data-driven fault identification is key to more sustainable facilities management

How data-driven analysis can help to identify fault detection and drive energy efficiencies for facilities of all sizes.

In a previous article on sustainable buildings, we talked about the approach of “sense, act, and scale” to drive efficiencies in buildings, and provided information using scientific publications. In this article, we will explore how data-driven analysis can help to identify fault detection and drive energy efficiencies for facilities management by providing details on:

  • Key challenges for building management and operations;
  • Building system design fundamentals;
  • Key data points to investigate faults for facilities-level sustainability; and
  • Data-driven fault identification on AWS

Global temperatures are on the rise, greenhouse gas (GHG) emissions are the primary contributor, and facilities are among the top contributors to GHG. As stipulated in the Paris Agreement, facilities need to be 30% more energy efficient and net carbon neutral by 2050. Many companies have set new targets to reduce their emissions in recent years. For example, Amazon has set out the mission to be net neutral by 2040 and, in its recent sustainability report, has touched on how the company is using innovative design to build sustainability into physical Amazon campuses.

NeurIPS competition involves reinforcement learning, with the objective of minimizing both cost and CO2 emissions.

This article provides information on how companies of all sizes can operate and maintain their existing buildings more efficiently by identifying and fixing faults using data-driven mechanisms. In this vein, Amazon is sponsoring an AI challenge at NeurIPS this year that focuses on building energy management in a smart grid. Bottom line: energy optimization of facilities must be a key component of your organization’s plan to operate more sustainably.

Related content
As office buildings become smarter, it is easier to configure them with sustainability management in mind.

Facility energy optimization provides an organization’s facilities team low-hanging-fruit opportunities for reducing costs and carbon. However, building systems do inherit many complexities that must be addressed.

Some of the key facilities-management challenges are:

  • A building’s lifespan is 50+ years, and a facility’s system sensors are typically installed on day one. Many new cloud-native sensor options come to market every year, but building management systems (BMS) aren’t open, making it difficult to modernize data architectures for building infrastructure;
  • Across any large real estate portfolio there is a wide range of technology, standards, building types, and designs that are difficult to manage over their lifecycles; 
  • Building management and automation systems require a third party to own and modify production data, and licensing fees aren’t based on consumption pricing; and 
  • Facilities teams generally lack the cloud expertise required to design a bespoke management solution, and their IT teams often don’t have product-level experience to provide as an alternative for addressing building-management needs.

Facilities management and sustainability

Facilities management teams have limited options to modify most core BMS functions.

These systems are sometimes referred to as black boxes in that they don’t have the same level of do-it-yourself features that most cloud users have come to expect. There can be contractual challenges, as well, for building tenants who don’t have access to BMS information. This is by design, primarily due to a clear operational argument that safety and security control functions should be limited to key personnel. However, this lack of access to building-performance analytics, required for enterprise-level sustainability transformations, is increasingly considered a blocker by many of our sustainability customers.

Let’s begin our analysis by looking at a building’s biggest consumer of electricity and producer of emissions: the HVAC system.

HVAC units are central to a building and constitute roughly 50% of a building’s energy consumption. As a result, they are well instrumented and generally follow a rules-based approach. The downside: this approach can lead to many false alarms and building managers rely on manual inspection and occupants to communicate important faults that require attention. Building managers and engineers focus significant time and budget on HVAC systems, but nevertheless HVAC system faults still can account for 5% to 20% of energy waste.

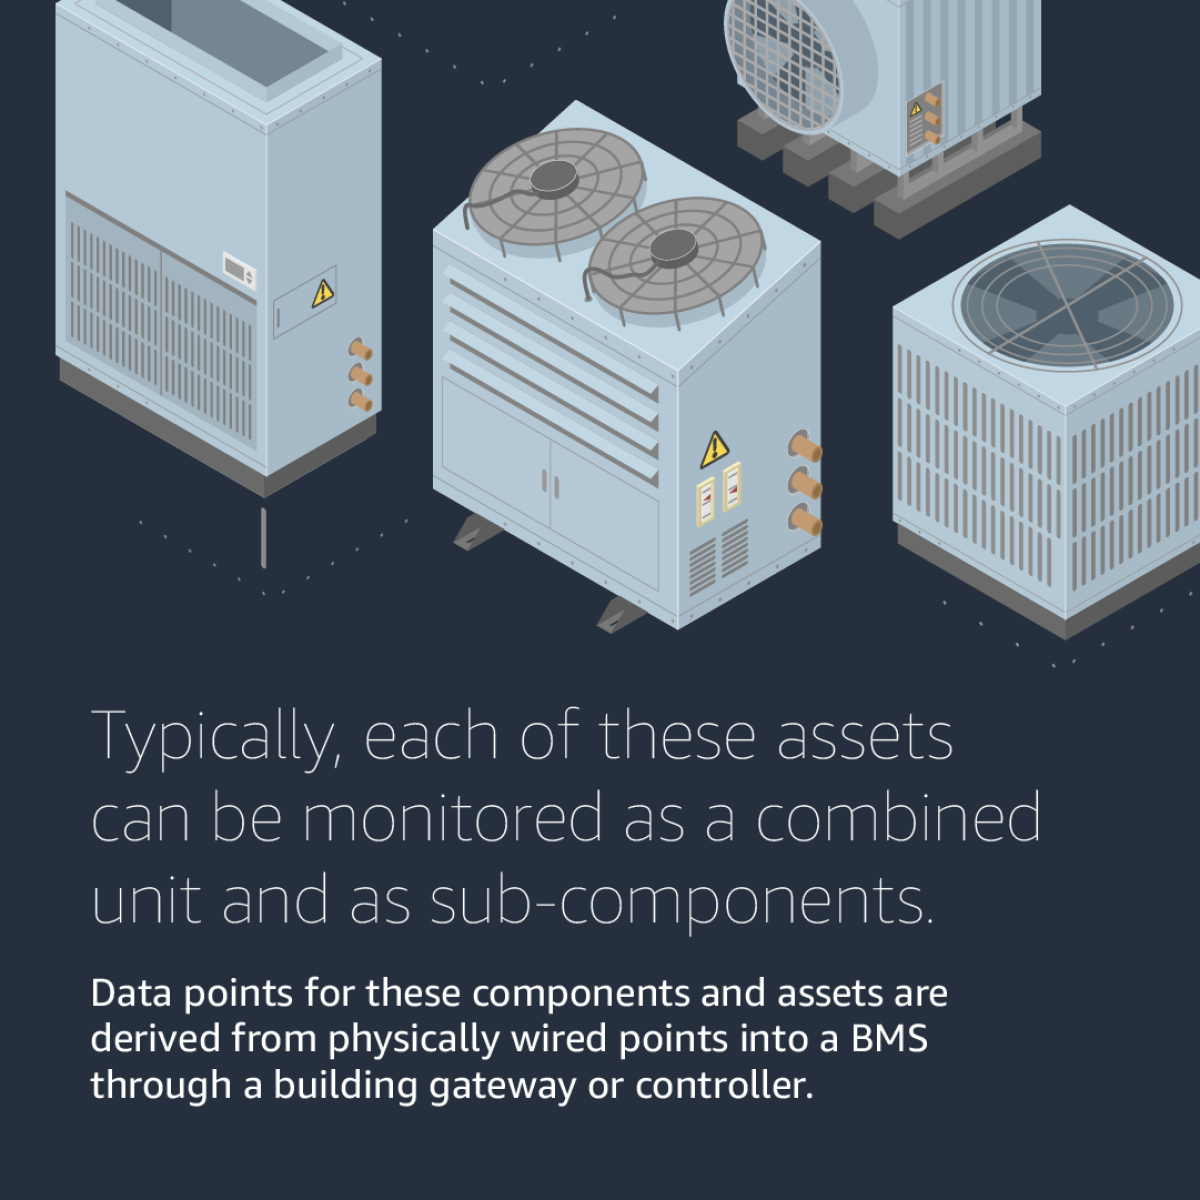
The most common example of an HVAC unit with which we are all familiar is an air conditioner. In a BMS, HVAC is comprised of sub-components that provide heating or cooling, ventilation (air handling units, fans) and AC (rooftop units, variable refrigerants) and more.
HVAC Units 2_220830211027 (1).png

A building’s data model, and the larger building management schema, are established when the building first opens. Alerts, alarms, and performance data are issued through the BMS and a manager will notify a building services team to take action as needed. However, as the building and infrastructure ages many alarms become endemic and are difficult to remedy. Alarm fatigue is a term often used to describe the resulting BMS operator experience.

Variable air volume (VAV) units are another important asset that help to maintain temperatures by managing local air flow. VAV units help optimize the temperature by modifying air flow as opposed to conventional air volume (CAV) units which provide a constant volume of air that only affects air temperature.

There are often hundreds of VAV units in a larger building and managing them is burdensome. Building engineers have limited time to configure each of them as building demands change and VAV unit configurations are typically left unchanged after the commissioning of the building. The result: many unseen or mysterious building faults, and the hidden loss of energy over the years.

Related content
Confronting climate change requires the participation of governments, companies, academics, civil-society organizations, and the public.

Many modern buildings are designed to accommodate whatever the building planners know at the time of commissioning. As a result, HVAC system configuration isn’t a data-driven process because operational data doesn’t yet exist. The only real incentives for HVAC system optimization typically result from failures and occupant complaints. To meet future sustainability targets, buildings must be equipped with data-driven smart configurations that can be adjusted automatically.

To achieve this, we must understand the fundamentals of air flow as we need to combine the expertise of building engineers, IoT engineers, and data engineers to resolve some of the complex air-flow challenges. This also requires an understanding of how facilities are generally managed today, which we’ll examine next.

Anatomy of facilities management

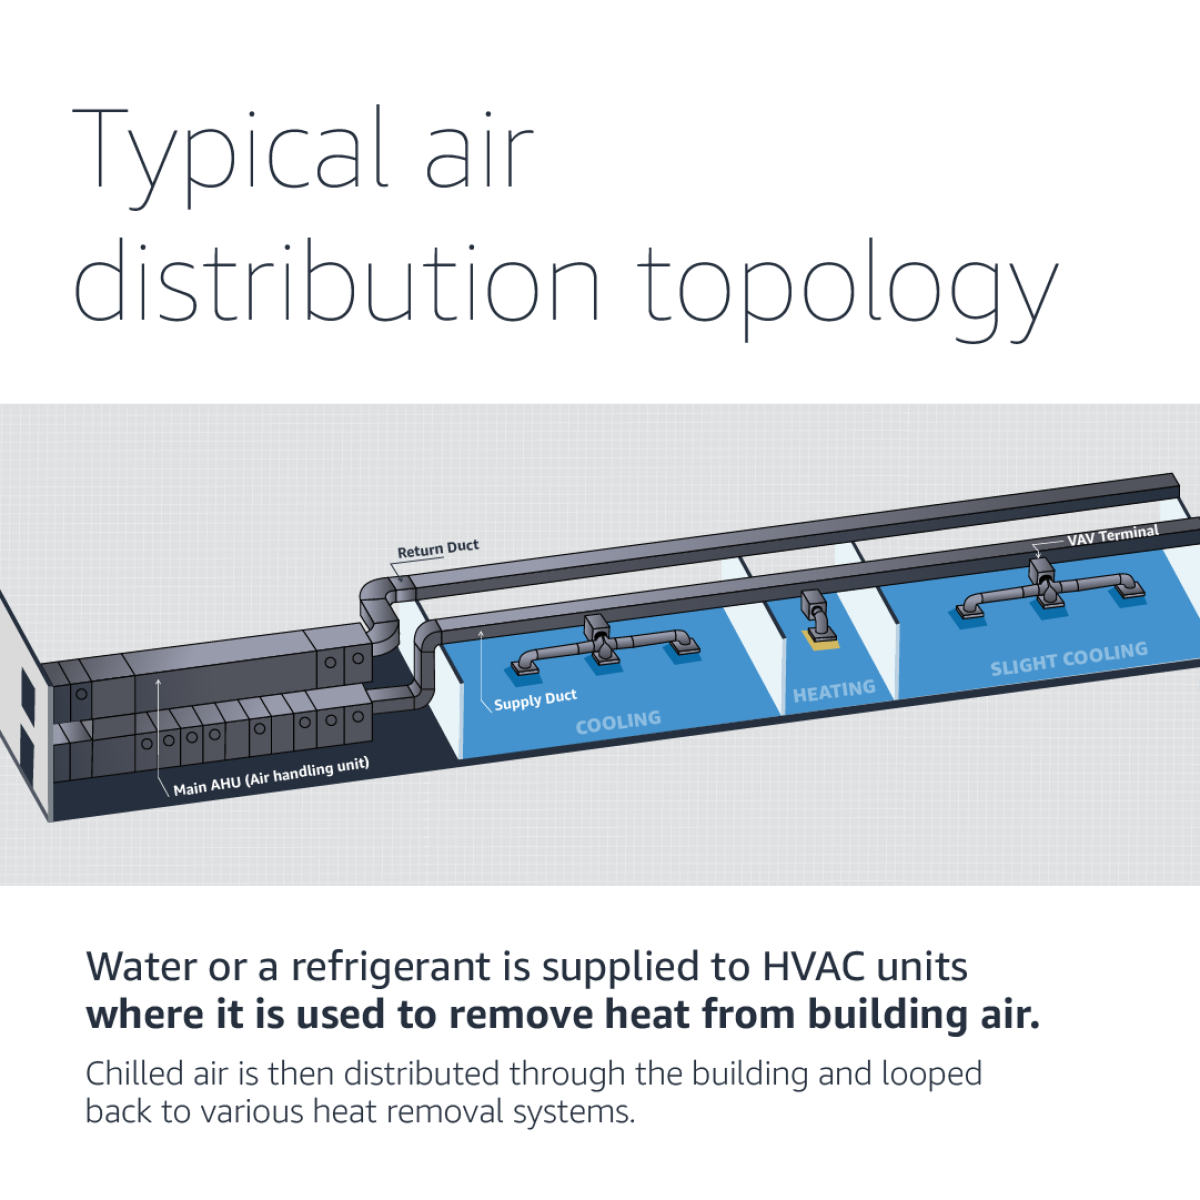
The image below shows how an air-handling unit (AHU) uses fans to distribute air through ducting. These ducts are attached to AHUs (a type of VAV unit), controlling the flow of air to specific rooms.
typical air distribution topology.png
BMS software provides tools to help operators define logical “zones” that virtually represent a given physical space. This zone approach is useful in helping operators analyze the effectiveness of a given cooling design relative to the operational requirements.

To change the temperature of a given zone (often representing a physical room), a sensor will send a notification through a building gateway and controller. This device serves as an intermediary between the BMS server and a given HVAC unit.

There is some automation built into these HVAC systems in the form of thermostats. The automation comes in the form of a given cooling unit responding to a temperature reading, calculated by the thermostat. These setpoints provide a temperature range that, when followed, provide the best performance of the system.

Setpoint typically refers to the point at which a building system is set to activate or deactivate, eg a heating system might be set to switch on if the internal temperature falls below 20°C.
VAV Terminal_220906154354.png
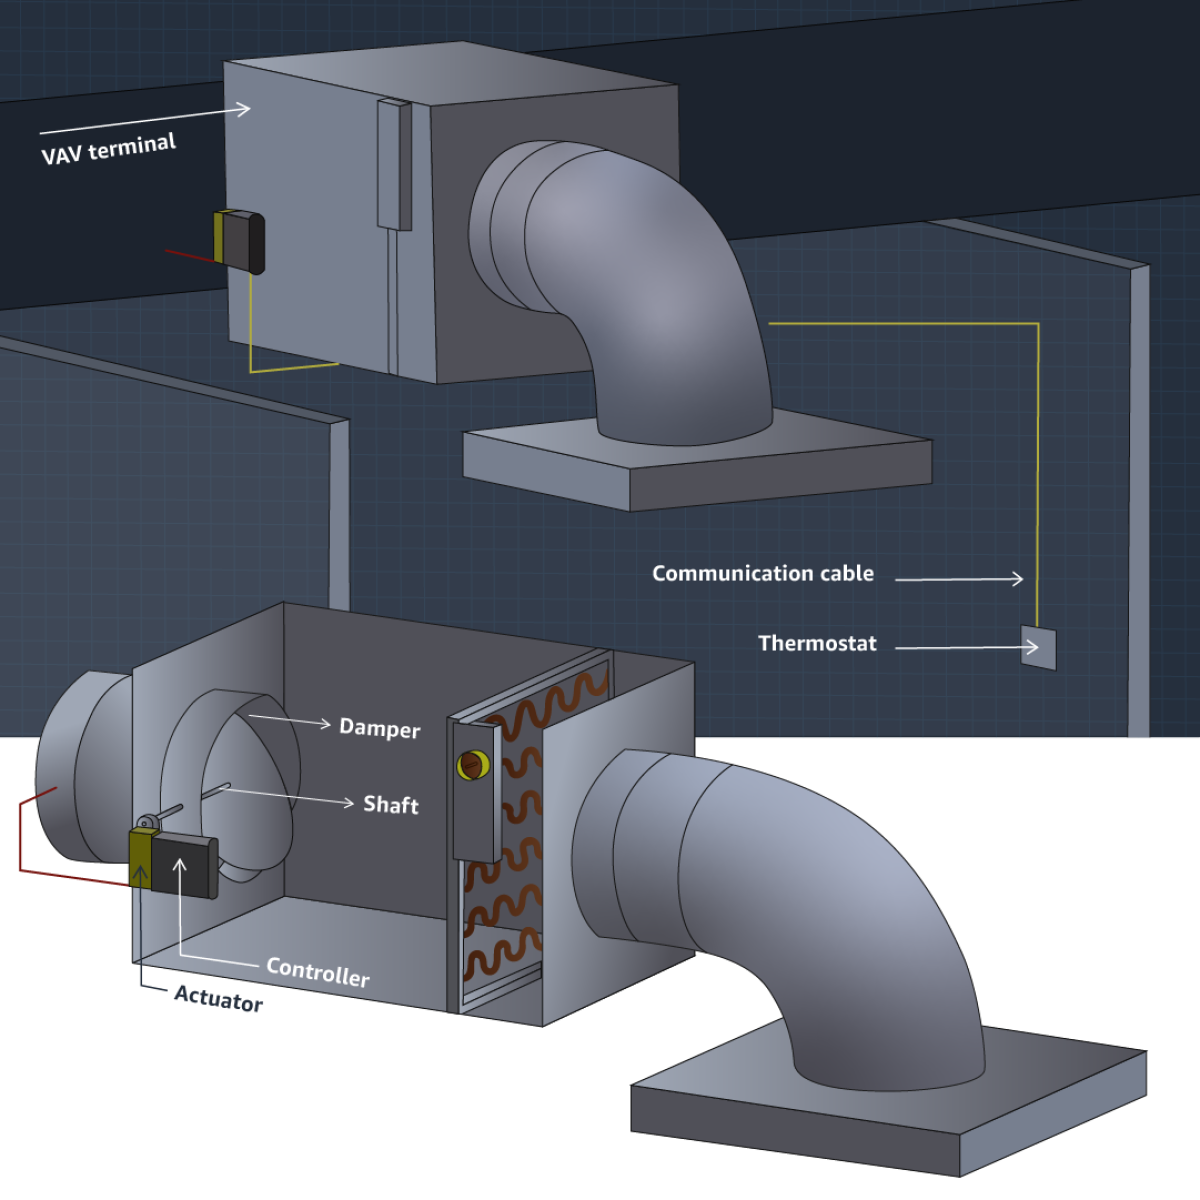
A controller in the VAV unit is attached to the room thermostat. Thermostats tells VAV terminals if zone temperatures are too hot, cold, or just right. The VAV unit has several key components inside: controller, actuator, damper, shaft, and reheat coil.

AHU and VAV unit control points are managed by BMS software. This software is vendor managed and the configuration of the control system is determined at building inception. The configurations can be established based on several factors: room capacity and occupancy, room location, room cooling requirement, zone requirement, and more.

To illustrate a data model that reflects the operation of the HVAC system, let’s look at the VAVs that help distribute the air and the fault-driven alerts apparent in most aging systems. It is difficult to personalize these configurations as they are not data driven and do not update automatically. Let's use the flow of air through a given building as a use case and assume its operation will have a sizable impact on the building's overall energy usage.
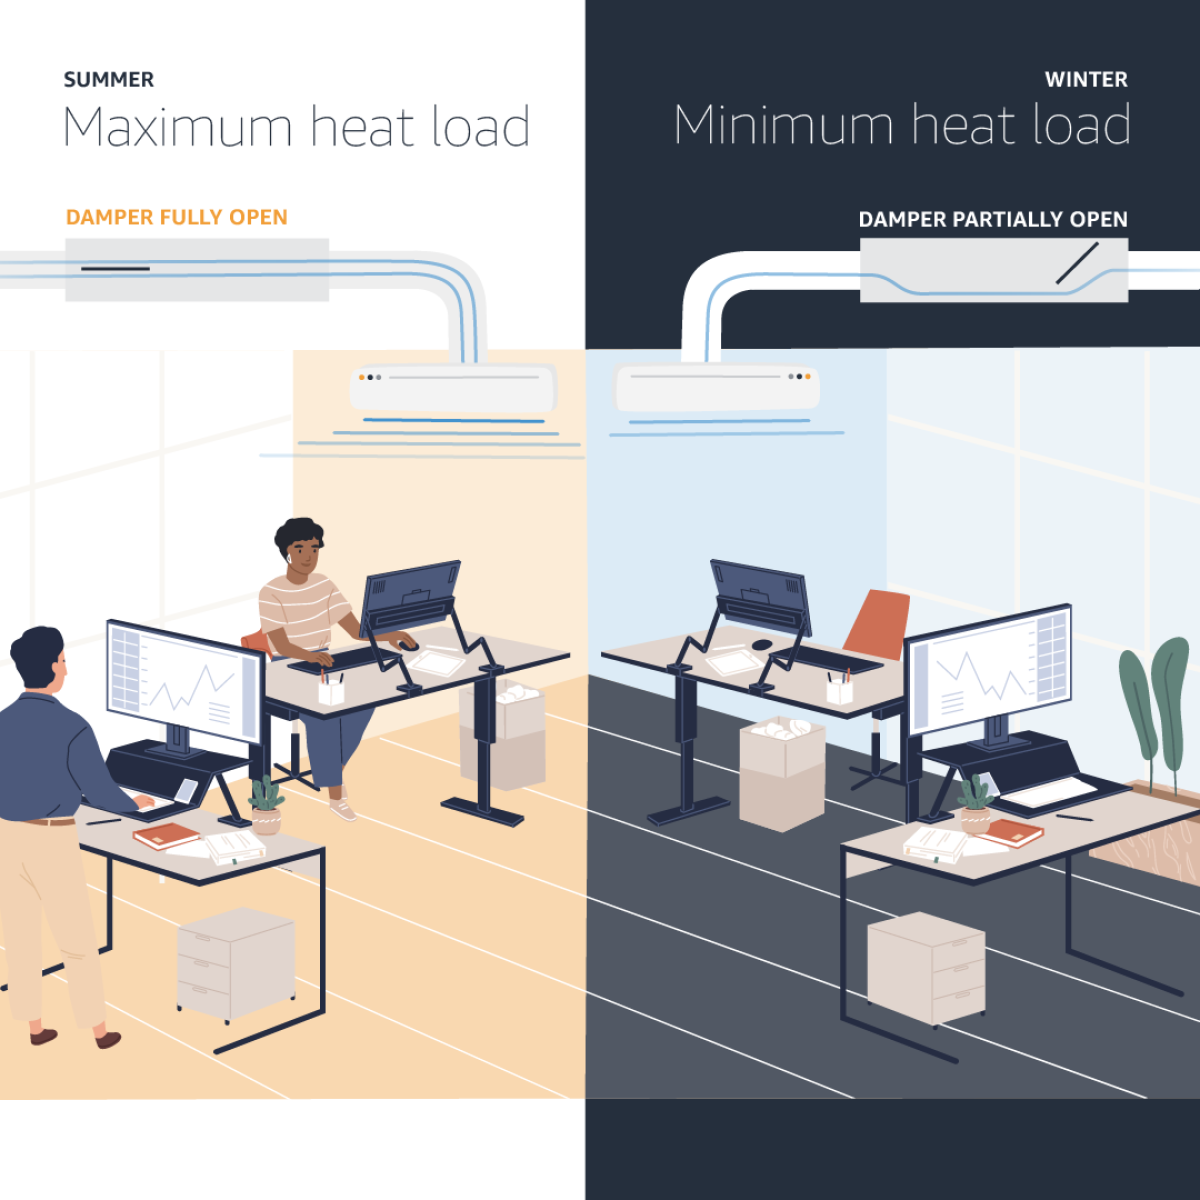
Damper Side-by-side_v2_220919101743.png
On the left, the damper is fully open because it is a summer day, it is hot outside, and the room is full of people. But on the right, the damper is partially open because it is a winter day and there are no people in the room, requiring minimum heat load.

There will often be multiple zone-specific faults, such as temperature or flow failures, issues with dampers or fans, software configuration errors that can lead to short-cycling of the unit(s), and communication or controller problems, which make it difficult to even identify the problem remotely. These factors all result in a low-efficiency cooling system that increases emissions, wasting energy and money.

What faults can tell you about sustainable building performance

Faults can be neglected for long periods of time, leaking invisible energy in the process.

Researchers from UC San Diego conducted a detailed data analysis (Bharathan was a co-author) of a 145,000-square-foot building. They identified 88 faults after building engineers fixed all the issues they could find. The paper estimates that fixing these faults could save 410.3 megawatt hours per year and, at a typical electrical cost of 12 cents per kilowatt hour, achieve a $492,360 savings in the first year.

According to the U.S. Environmental Protection Agency’s Greenhouse Gas Equivalencies Calculator, that’s the equivalent of 38,244 passenger car trips abated. Cisco offers another example. The company achieved a 28% reduction in electrical usage in their buildings worldwide by using an IP-Enabled Energy Management solution.

Traditional fault fixing focuses on the centralized HVAC subsystems such as AHU. Here we focus on the VAV units that are often ignored. Some of the key issues in VAV units are: air supply flow, temperature setpoints, thermostat adjustments, inappropriate cooling or stuck dampers.

Related content
Pioneering web-based PackOpt tool has resulted in an annual reduction in cardboard waste of 7% to 10% in North America, saving roughly 60,000 tons of cardboard annually.

To identify these faults, you can perform data analysis with key data attributes including temperature, heating, and cooling setpoints; upper- and lower- limit changes based on day of week; re-heat coil (on or off); occupancy sensor and settings (occupied, standby or unoccupied); damper sensor and damper settings; and pressure flow.

Using these parameters, we can define informative models. For example, you can create setpoints informed by seasonal weather data, in addition to room thermostats. You also can perform temperature data analysis against known occupancy times.

Data analysis isn’t easy at first; it’s generally not in a state where it can be readily loaded into a graph store. Oftentimes there is a lot of data transformation and IoT work required to get the data to a place where it can be analyzed by data scientists. To solve this challenge, you will need data experts, FM domain experts, cloud engineers, and someone who can bring them together to drive the right focus.

To begin, the best approach is setting up a meeting between your facilities and IT teams to start examining your building data. Some teams may grant you read-only access to the system. Otherwise, from a .CSV download of the last two to three years of building data, you can perform your analysis.

For data- driven fault identification within your facilities data, you can get started by using the Model, Cluster, and Compare (MCC approach). The primary objective of MCC is to determine clusters of zones within a building, and then use these clusters to automatically determine misconfigured, anomalous, or faulty zone controller configuration.

MCC approach to data-driven analysis

We will use a university-building example to explain the benefits of the MCC approach. The university building comprised personal offices, shared offices, kitchens, and restrooms.

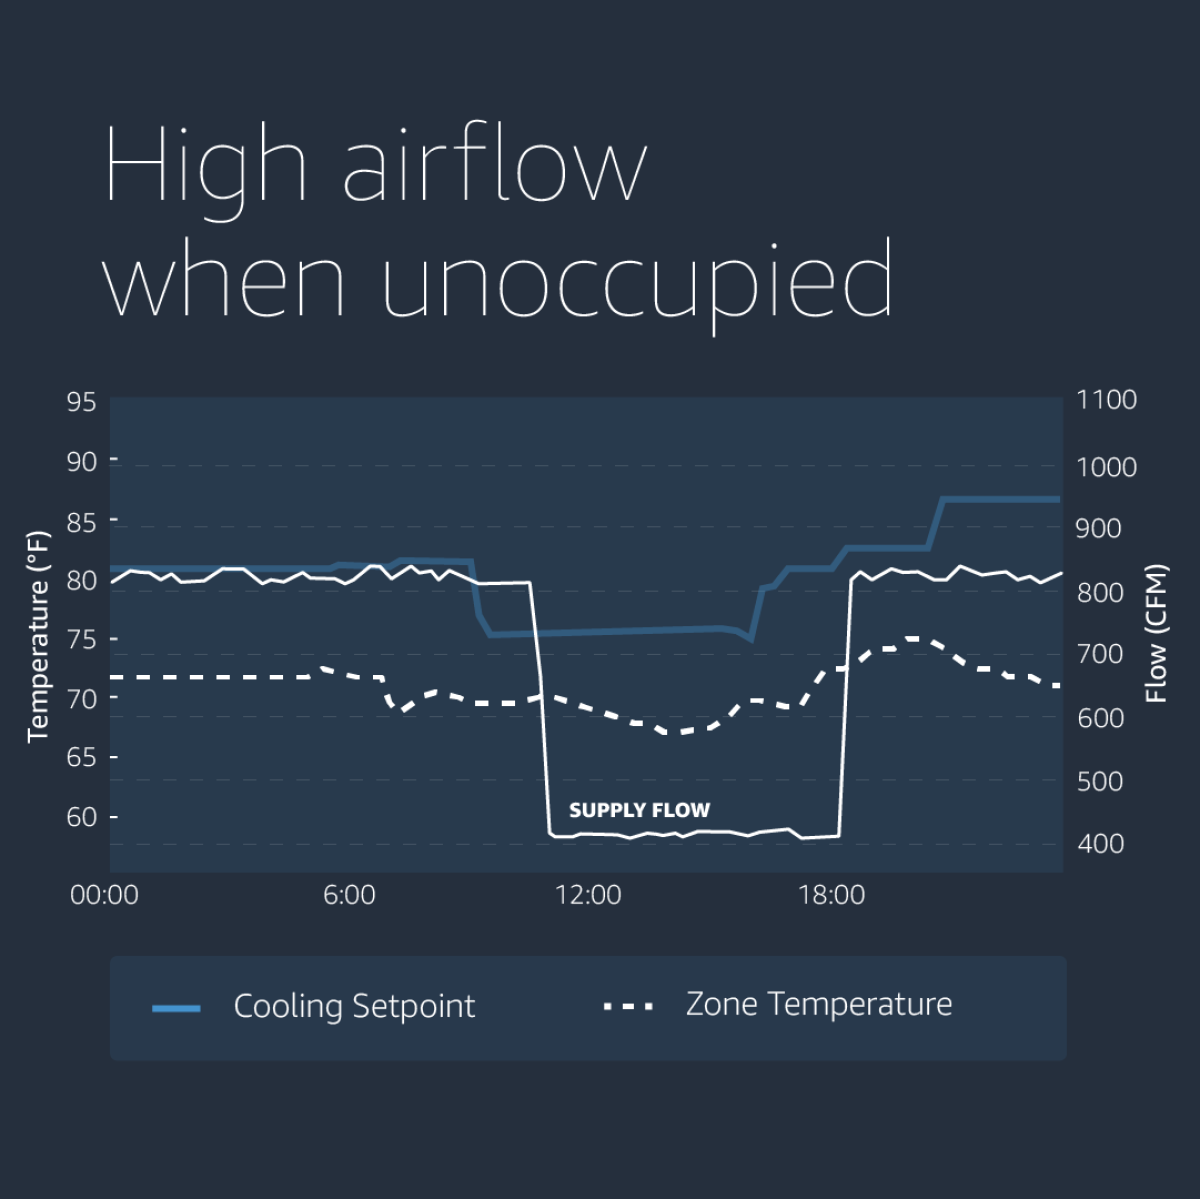
In a typical room, the HVAC provides cold air during the summer. The supplied air flow is modulated to maintain the required temperature during day time, and falls back to a minimum during the night.

In the graph below, we show a room where the opposite happens because of a misconfiguration fault.
Supply Flow Graphic 1_220831110607.png
The VAV unit cools the room at night, but uses a minimal air flow during the day. The cooling temperature setpoint is 80°F from midnight until 10 a.m., and then drops to 75°F as expected. However, there is a continuous cold air supply flow of 800 cubic feet per minute (CFM) throughout the night until 11:30 a.m.

The building management contractor surmised these errors were caused due to a misunderstanding at the time of initial building commissioning. This fault was hidden within the system for years, and was identified while doing an MCC analysis.

Model

When we try to identify faults with raw sensor data, it often leads to misleading results. For example, a simple fault detection rule may generate an alarm if the temperature of a room goes beyond a threshold. The alarm may be false for any number of reasons: it could be a particularly hot day, or an event is occurring in the room. We need to look for faults that are consistent, and require human attention. Given the large number of alarms that are triggered with simple rules, such faults get overlooked.

Our MCC algorithm looks for rooms that behave differently from others over a long time-span. To compare different rooms, we create a model that captures the generic patterns of usage over months or years. Then we can compare and cluster rooms to weed out the faults.

In our algorithm, we use the measured room temperature and air flow from the HVAC to create a room energy model. The energy spent by the HVAC system on a room is proportional to the product of its temperature and airflow supplied as per the laws of thermodynamics. We use the product of two sensor measurements as the parameter to model the room because it indicates the generic patterns of use. If we find rooms whose energy patterns are substantially different, we can inspect them further.

Cluster

Room temperatures can fluctuate for natural reasons, and our fault-detection algorithm should not flag them.

The MCC algorithm clusters rooms that are similar to each other with the KMeans algorithm. The clusters naturally align rooms that are similar, for example, west-facing rooms, east-facing rooms, kitchenettes, and conference rooms. We can create these clusters manually, based on domain knowledge and usage type, or the clustering algorithm can automate this process.

Compare

Having defined configurations per cluster, the MCC algorithm then compares rooms to identify anomalies. This step ensures that natural fluctuations are ignored, and only the egregious rooms are highlighted, reducing the number of false alarms.

Intelligent rules

The MCC study created rules to detect new faults after analyzing the anomalies manually. Rules are a natural way to integrate with an existing system, and to catch similar faults that occur in the future. Rules are also interpretable by domain experts, enabling further tuning.

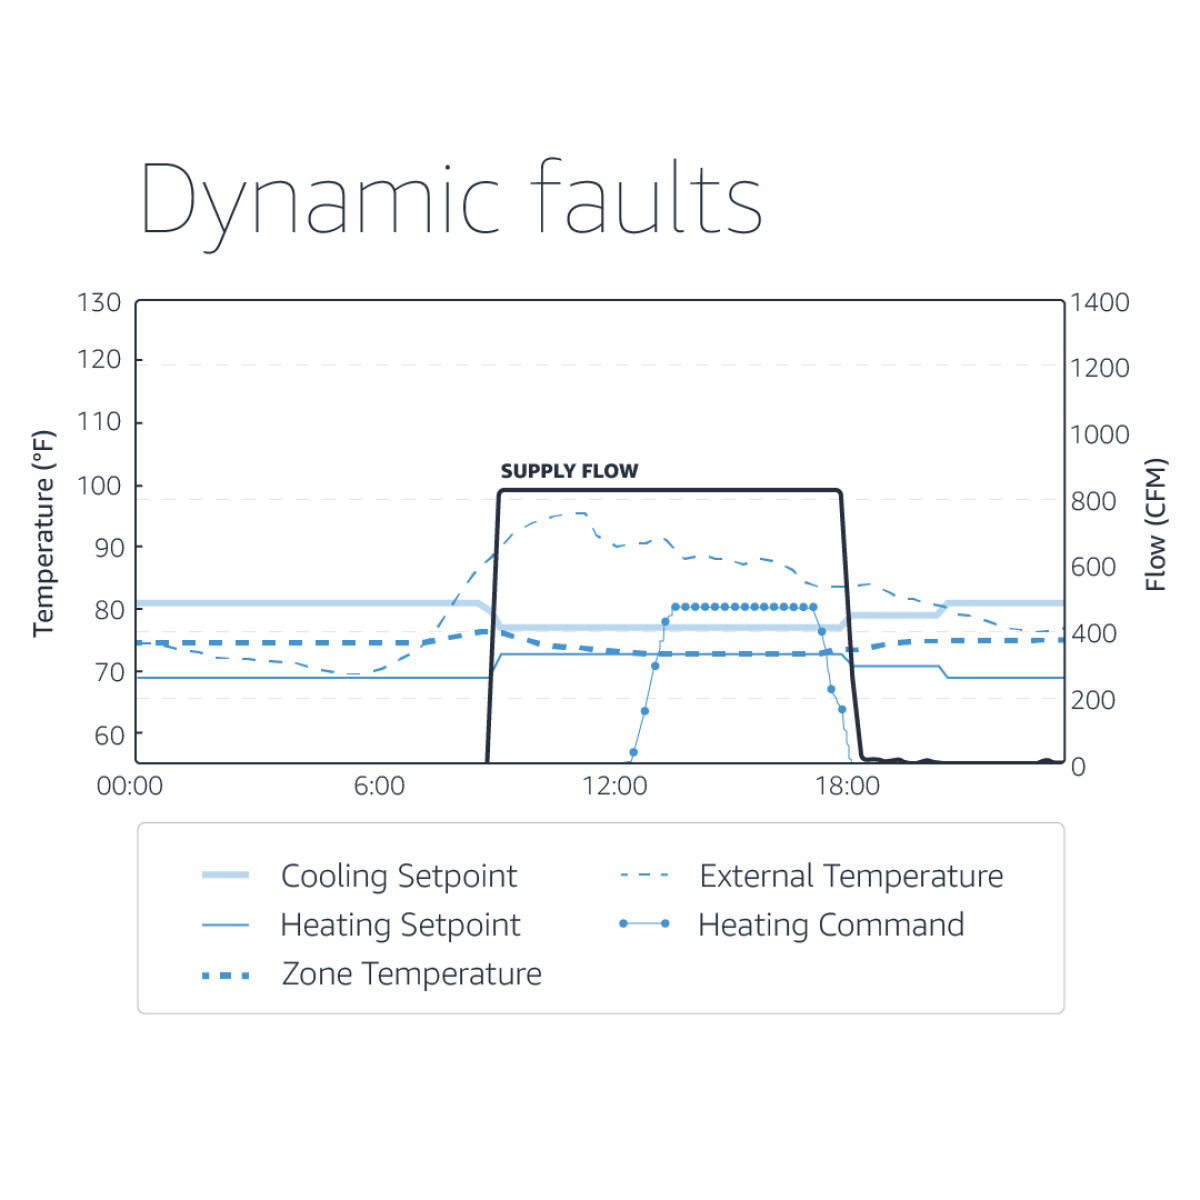
An interesting example of an identified fault is shown below:
Supply Flow Graphic 2_220831110647.png
The HVAC system strives to maintain the room temperature between the cooling setpoint (78F in this room) and the heating setpoint (74F). If the temperature goes beyond these setpoints, it will cool/heat the room as required. The room is excessively cooled with high air flow (800 CFM), causing the room temperature to fall below the heating setpoint, which then triggers heating. As a result of this fault, the room uses excessive energy to maintain comfort.

There were five rooms with similar issues on the same floor and 15 overall within the building. The cause of the fault: the designed air flow specifications were based on maximum occupancy. Issues such as these cause enormous energy waste, and they often go unnoticed for years.

A path forward 

In this post we’ve provided some foundational concepts to consider in how you can better use data to improve both facility performance and availability.

Whether your goal is to improve building performance in support of sustainability transformation or to improve fault detection, the path starts with modernizing the data models that support your facilities. Following a data modernization path will illustrate where the building architecture that provides the data is not meeting expectations.

As a next step, facilities and IT managers can get started by:

  • Performing a basic audit of their buildings and look for options to gather key parameter data outlined above. 
  • Consolidating data from the relevant sources, applying data standardization, and making use of the fault-detection approach outlined above. 
  • Making use of AWS Data Analytics and AWS AI/ML services to perform data analysis and apply machine learning algorithms to identify data anomalies. Amazon uses these services to manage the thousands of world-class facilities that serve our employees, customers, and communities. Learn more about our sustainable building initiatives

These steps will help identify energy hot spots and hidden faults in your facilities; facilities managers can then make use of this information to fix the relevant faults and drive facility sustainability. Finally, consider making sustainability data easily accessible to executive teams to help drive discussions and decisions on impactful carbon-abatement initiatives.

Research areas

Related content

US, WA, Seattle
This is a unique opportunity to build technology and science that millions of people will use every day. Are you excited about working on large scale Natural Language Processing (NLP), Machine Learning (ML), and Deep Learning (DL)? We are embarking on a multi-year journey to improve the shopping experience for customers globally. Amazon Search team creates customer-focused search solutions and technologies that makes shopping delightful and effortless for our customers. Our goal is to understand what customers are looking for in whatever language happens to be their choice at the moment and help them find what they need in Amazon's vast catalog of billions of products. As Amazon expands to new geographies, we are faced with the unique challenge of maintaining the bar on Search Quality due to the diversity in user preferences, multilingual search and data scarcity in new locales. We are looking for an applied researcher to work on improving search on Amazon using NLP, ML, and DL technology. As an Applied Scientist, you will lead our efforts in query understanding, semantic matching (e.g. is a drone the same as quadcopter?), relevance ranking (what is a "funny halloween costume"?), language identification (did the customer just switch to their mother tongue?), machine translation (猫の餌を注文する). This is a highly visible role with a huge impact on Amazon customers and business. As part of this role, you will develop high precision, high recall, and low latency solutions for search. Your solutions should work for all languages that Amazon supports and will be used in all Amazon locales world-wide. You will develop scalable science and engineering solutions that work successfully in production. You will work with leaders to develop a strategic vision and long term plans to improve search globally. We are growing our collaborative group of engineers and applied scientists by expanding into new areas. This is a position on Global Search Quality team in Seattle Washington. We are moving fast to change the way Amazon search works. Together with a multi-disciplinary team you will work on building solutions with NLP/ML/DL at its core. Along the way, you’ll learn a ton, have fun and make a positive impact on millions of people. Come and join us as we invent new ways to delight Amazon customers.
US, WA, Seattle
The retail pricing science and research group is a team of scientists and economists who design and implement the analytics powering pricing for Amazon’s on-line retail business. The team uses world-class analytics to make sure that the prices for all of Amazon’s goods and services are aligned with Amazon’s corporate goals. We are seeking an experienced high-energy Economist to help envision, design and build the next generation of retail pricing capabilities. You will work at the intersection of economic theory, statistical inference, and machine learning to design new methods and pricing strategies to deliver game changing value to our customers. Roughly 85% of previous intern cohorts have converted to full time scientist employment at Amazon. If you are interested, please send your CV to our mailing list at econ-internship@amazon.com. Key job responsibilities Amazon’s Pricing Science and Research team is seeking an Economist to help envision, design and build the next generation of pricing capabilities behind Amazon’s on-line retail business. As an economist on our team, you will work at the intersection of economic theory, statistical inference, and machine learning to design new methods and pricing strategies with the potential to deliver game changing value to our customers. This is an opportunity for a high-energy individual to work with our unprecedented retail data to bring cutting edge research into real world applications, and communicate the insights we produce to our leadership. This position is perfect for someone who has a deep and broad analytic background and is passionate about using mathematical modeling and statistical analysis to make a real difference. You should be familiar with modern tools for data science and business analysis. We are particularly interested in candidates with research background in applied microeconomics, econometrics, statistical inference and/or finance. A day in the life Discussions with business partners, as well as product managers and tech leaders to understand the business problem. Brainstorming with other scientists and economists to design the right model for the problem in hand. Present the results and new ideas for existing or forward looking problems to leadership. Deep dive into the data. Modeling and creating working prototypes. Analyze the results and review with partners. Partnering with other scientists for research problems. About the team The retail pricing science and research group is a team of scientists and economists who design and implement the analytics powering pricing for Amazon’s on-line retail business. The team uses world-class analytics to make sure that the prices for all of Amazon’s goods and services are aligned with Amazon’s corporate goals.
US, CA, San Francisco
The retail pricing science and research group is a team of scientists and economists who design and implement the analytics powering pricing for Amazon's on-line retail business. The team uses world-class analytics to make sure that the prices for all of Amazon's goods and services are aligned with Amazon's corporate goals. We are seeking an experienced high-energy Economist to help envision, design and build the next generation of retail pricing capabilities. You will work at the intersection of statistical inference, experimentation design, economic theory and machine learning to design new methods and pricing strategies for assessing pricing innovations. Roughly 85% of previous intern cohorts have converted to full time scientist employment at Amazon. If you are interested, please send your CV to our mailing list at econ-internship@amazon.com. Key job responsibilities Amazon's Pricing Science and Research team is seeking an Economist to help envision, design and build the next generation of pricing capabilities behind Amazon's on-line retail business. As an economist on our team, you will will have the opportunity to work with our unprecedented retail data to bring cutting edge research into real world applications, and communicate the insights we produce to our leadership. This position is perfect for someone who has a deep and broad analytic background and is passionate about using mathematical modeling and statistical analysis to make a real difference. You should be familiar with modern tools for data science and business analysis. We are particularly interested in candidates with research background in experimentation design, applied microeconomics, econometrics, statistical inference and/or finance. A day in the life Discussions with business partners, as well as product managers and tech leaders to understand the business problem. Brainstorming with other scientists and economists to design the right model for the problem in hand. Present the results and new ideas for existing or forward looking problems to leadership. Deep dive into the data. Modeling and creating working prototypes. Analyze the results and review with partners. Partnering with other scientists for research problems. About the team The retail pricing science and research group is a team of scientists and economists who design and implement the analytics powering pricing for Amazon's on-line retail business. The team uses world-class analytics to make sure that the prices for all of Amazon's goods and services are aligned with Amazon's corporate goals.
US, WA, Bellevue
We are looking for detail-oriented, organized, and responsible individuals who are eager to learn how to work with large and complicated data sets. Some knowledge of econometrics, as well as basic familiarity with Python is necessary, and experience with SQL and UNIX would be a plus. These are full-time positions at 40 hours per week, with compensation being awarded on an hourly basis. You will learn how to build data sets and perform applied econometric analysis at Internet speed collaborating with economists, scientists, and product managers. These skills will translate well into writing applied chapters in your dissertation and provide you with work experience that may help you with placement. Roughly 85% of interns from previous cohorts have converted to full time economics employment at Amazon. If you are interested, please send your CV to our mailing list at econ-internship@amazon.com.
US
The Amazon Supply Chain Optimization Technology (SCOT) organization is looking for an Intern in Economics to work on exciting and challenging problems related to Amazon's worldwide inventory planning. SCOT provides unique opportunities to both create and see the direct impact of your work on billions of dollars’ worth of inventory, in one of the world’s most advanced supply chains, and at massive scale. We are looking for detail-oriented, organized, and responsible individuals who are eager to learn how to work with large and complicated data sets. We are looking for a PhD candidate with exposure to Program Evaluation/Causal Inference. Knowledge of econometrics and Stata/R/or Python is necessary, and experience with SQL, Hadoop, and Spark would be a plus. These are full-time positions at 40 hours per week, with compensation being awarded on an hourly basis. You will learn how to build data sets and perform applied econometric analysis at Internet speed collaborating with economists, scientists, and product managers. These skills will translate well into writing applied chapters in your dissertation and provide you with work experience that may help you with placement. Roughly 85% of previous cohorts have converted to full time scientist employment at Amazon. If you are interested, please send your CV to our mailing list at econ-internship@amazon.com.
US, WA, Seattle
The Selling Partner Fees team owns the end-to-end fees experience for two million active third party sellers. We own the fee strategy, fee seller experience, fee accuracy and integrity, fee science and analytics, and we provide scalable technology to monetize all services available to third-party sellers. We are looking for an Intern Economist with excellent coding skills to design and develop rigorous models to assess the causal impact of fees on third party sellers’ behavior and business performance. As a Science Intern, you will have access to large datasets with billions of transactions and will translate ambiguous fee related business problems into rigorous scientific models. You will work on real world problems which will help to inform strategic direction and have the opportunity to make an impact for both Amazon and our Selling Partners.
US, WA, Bellevue
We are looking for detail-oriented, organized, and responsible individuals who are eager to learn how to work with large and complicated data sets. We are looking for a PhD candidate with exposure to Program Evaluation/Causal Inference. Some knowledge of econometrics, as well as basic familiarity with Stata or R is necessary, and experience with SQL, Hadoop, Spark and Python would be a plus. These are full-time positions at 40 hours per week, with compensation being awarded on an hourly basis. You will learn how to build data sets and perform applied econometric analysis at Internet speed collaborating with economists, scientists, and product managers. These skills will translate well into writing applied chapters in your dissertation and provide you with work experience that may help you with placement. Roughly 85% of previous cohorts have converted to full time scientist employment at Amazon. If you are interested, please send your CV to our mailing list at econ-internship@amazon.com.
US, MA, Westborough
Are you inspired by invention? Is problem solving through teamwork in your DNA? Do you like the idea of seeing how your work impacts the bigger picture? Answer yes to any of these and you’ll fit right in here at Amazon Robotics. We are a smart team of doers that work passionately to apply cutting edge advances in robotics and software to solve real-world challenges that will transform our customers’ experiences in ways we can’t even imagine yet. We invent new improvements every day. We are Amazon Robotics and we will give you the tools and support you need to invent with us in ways that are rewarding, fulfilling and fun. Amazon Robotics is seeking interns and co-ops with a passion for robotic research to work on cutting edge algorithms for robotics. Our team works on challenging and high-impact projects, including allocating resources to complete a million orders a day, coordinating the motion of thousands of robots, autonomous navigation in warehouses, identifying objects and damage, and learning how to grasp all the products Amazon sells. We are seeking internship candidates with backgrounds in computer vision, machine learning, resource allocation, discrete optimization, search, and planning/scheduling. You will be challenged intellectually and have a good time while you are at it! Please note that by applying to this role you would be considered for Applied Scientist summer intern, spring co-op, and fall co-op roles on various Amazon Robotics teams. These teams work on robotics research within areas such as computer vision, machine learning, robotic manipulation, navigation, path planning, perception, artificial intelligence, human-robot interaction, optimization and more.
US, WA, Bellevue
We are looking for detail-oriented, organized, and responsible individuals who are eager to learn how to work with large and complicated data sets. Some knowledge of econometrics, as well as basic familiarity with Python is necessary, and experience with SQL and UNIX would be a plus. These are full-time positions at 40 hours per week, with compensation being awarded on an hourly basis. You will learn how to build data sets and perform applied econometric analysis at Internet speed collaborating with economists, scientists, and product managers. These skills will translate well into writing applied chapters in your dissertation and provide you with work experience that may help you with placement. Roughly 85% of previous cohorts have converted to full time scientist employment at Amazon. If you are interested, please send your CV to our mailing list at econ-internship@amazon.com.