Knowledge graphs are data structures that capture relationships between data in a very flexible manner. They can help make information retrieval more precise, and they can also be used to uncover previously unknown relationships in large data sets.
Manually assembling knowledge graphs is extremely time consuming, so researchers in the field have long been investigating techniques for producing them automatically. The approach has been successful for domains such as movie information, which feature relatively few types of relationships and abound in sources of structured data.
Automatically producing knowledge graphs is much more difficult in the case of retail products, where the types of relationships between data items are essentially unbounded — color for clothes, flavor for candy, wattage for electronics, and so on — and where much useful information is stored in free-form product descriptions, customer reviews, and question-and-answer forums.

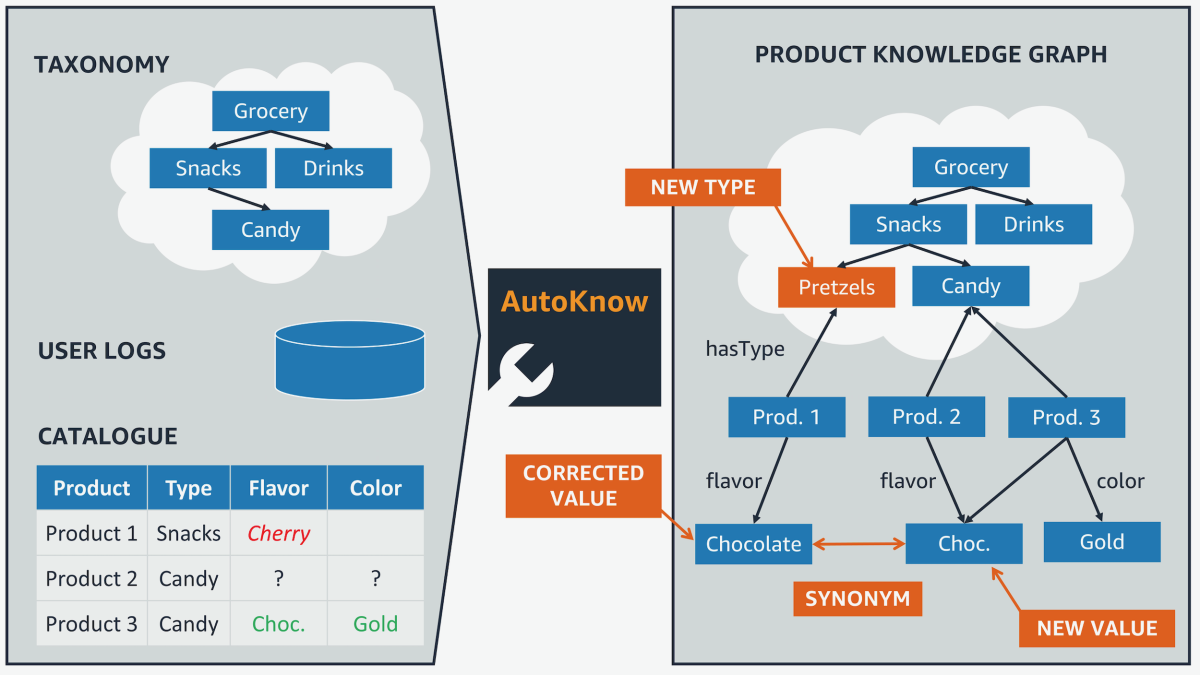
This year, at the Association for Computing Machinery’s annual conference on Knowledge Discovery and Data Mining (KDD), my colleagues and I will present a system we call AutoKnow, a suite of techniques for automatically augmenting product knowledge graphs with both structured data and data extracted from free-form text sources.
With AutoKnow, we increased the number of facts in Amazon’s consumables product graph (which includes the categories grocery, beauty, baby, and health) by almost 200%, identifying product types with 87.7% accuracy.
We also compared each of our system’s five modules, which execute tasks such as product type extraction and anomaly detection, to existing systems and found that they improved performance across the board, often quite dramatically (an improvement of more than 300% in the case of product type extraction).
The AutoKnow framework
Knowledge graphs typically consist of entities — the nodes of the graph, often depicted as circles — and relations between the entities — usually depicted as line segments connecting nodes. The entity “drink”, for example, might be related to the entity “coffee” by the relationship “contains”. The entity “bag of coffee” might be related to the entity “16 ounces” by the relationship “has_volume”.
In a narrow domain such as movie information, the number of entity types — such as director, actor, and editor — is limited, as are the number of relationships — directed, performed in, edited, and so on. Moreover, movie sources often provide structured data, explicitly listing cast and crew.
In a retail domain, on the other hand, the number of product types tends to grow as the graph expands. Each product type has its own set of attributes, which may be entirely different from the next product type’s — color and texture, for instance, versus battery type and effective range. And the vital information about a product — that a coffee mug gets too hot to hold, for instance — could be buried in the free-form text of a review or question-and-answer section.
AutoKnow addresses these challenges with five machine-learning-based processing modules, each of which builds on the outputs of the one that precedes it:
- Taxonomy enrichment extends the number of entity types in the graph;
- Relation discovery identifies attributes of products, those attributes’ range of possible values (different flavors or colors, for instance), and, crucially, which of those attributes are important to customers;
- Data imputation uses the entity types and relations discovered by the previous modules to determine whether free-form text associated with products contains any information missing from the graph;
- Data cleaning sorts through existing and newly extracted data to see whether any of it was misclassified in the source texts; and
- Synonym finding attempts to identify entity types and attribute values that have the same meaning.
The ontology suite
The inputs to AutoKnow include an existing product graph; a catalogue of products that includes some structured information, such as labeled product names, and unstructured product descriptions; free-form product-related information, such as customer reviews and sets of product-related questions and answers; and product query data.
To identify new products, the taxonomy enrichment module uses a machine learning model that labels substrings of the product titles in the source catalogue. For instance, in the product title “Ben & Jerry’s black cherry cheesecake ice cream”, the model would label the substring “ice cream” as the product type.
The same model also labels substrings that indicate product attributes, for use during the relation discovery step. In this case, for instance, it would label “black cherry cheesecake” as the flavor attribute. The model is trained on product descriptions whose product types and attributes have already been classified according to a hand-engineered taxonomy.
Next, the taxonomy enrichment module classifies the newly extracted product types according to their hypernyms, or the broader product categories that they fall under. Ice cream, for instance, falls under the hypernym “Ice cream and novelties”, which falls under the hypernym “Frozen”, and so on.
The hypernym classifier uses data about customer interactions, such as which products customers viewed or purchased after a single query. Again, the machine learning model is trained on product data labeled according to an existing taxonomy.
Relation discovery
The relation discovery module classifies product attributes according to two criteria. The first is whether the attribute applies to a given product. The attribute flavor, for instance, applies to food but not to clothes.
The second criterion is how important the attribute is to buyers of a particular product. Brand name, it turns out, is more important to buyers of snack foods than to buyers of produce.
Both classifiers analyze data provided by providers — product descriptions — and by customers — reviews and Q&As. With both types of input data, the classifiers consider the frequency with which attribute words occur in texts associated with a given product; with the provider data, they also consider how frequently a given word occurs across instances of a particular product type.
The models were trained on data that had been annotated to indicate whether particular attributes applied to the associated products.
The data suite
Step three, data imputation, looks for terms in product descriptions that may fit the new product and attribute categories identified in the previous steps, but which have not yet been added to the graph.
This step uses embeddings, which represent descriptive terms as points in a vector space, where related terms are grouped together. The idea is that, if a number of terms clustered together in the space share the same attribute or product type, the unlabeled terms in the same cluster should, too.
Previously, my Amazon colleagues and I, together with colleagues at the University of Utah, demonstrated state-of-the-art data imputation results by training a sequence-tagging model, much like the one I described above, which labeled “black cherry cheesecake” as a flavor.
Here, however, we vary that approach by conditioning the sequence-tagging model on the product type: that is, the tagged sequence output by the model depends on the product type, whose embedding we include among the inputs.

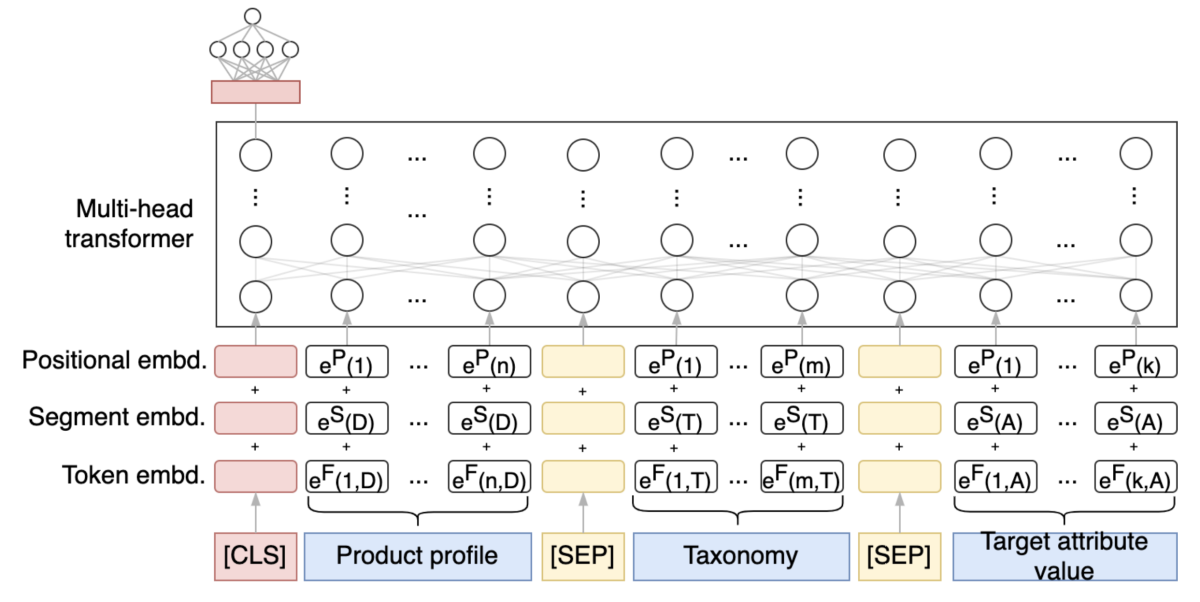
The next step is data cleaning, which uses a machine learning model based on the Transformer architecture. The inputs to the model are a textual product description, an attribute (flavor, volume, color, etc.), and a value for that attribute (chocolate, 16 ounces, blue, etc.). Based on the product description, the model decides whether the attribute value is misassigned.
To train the model, we collect valid attribute-value pairs that occur across many instances of a single product type (all ice cream types, for instance, have flavors); these constitute the positive examples. We also generate negative examples by replacing the values in valid attribute-value pairs with mismatched values.
Finally, we analyze our product and attribute sets to find synonyms that should be combined in a single node of the product graph. First, we use customer interaction data to identify items that were viewed during the same queries; their product and attribute descriptions are candidate synonyms.
Then we use a combination of techniques to filter the candidate terms. These include edit distance (a measure of the similarity of two strings of characters) and a neural network. In tests, this approach yielded a respectable .83 area under the precision-recall curve.
In ongoing work, we’re addressing a number of outstanding questions, such as how to handle products with multiple hypernyms (products that have multiple “parents” in the product hierarchy), cleaning data before it’s used to train our models, and using image data as well as textual data to improve our models’ performance.
Watch a video presentation of the AutoKnow paper from Jun Ma, senior applied scientist.


